Posts

Customers Dashboard

Customers Dashboard

The Customers Dashboard in PaySketch taps on the most important of all aspects you would like to know in your online business – your Customers. Where Customer is the King, knowing your customers can help you find issues, get feedback and gauge customer loyalty.

This dashboard shows a list of all the Customers who have purchased atleast once from your business through PayPal, also listing the number of orders and the total amount spent. To analyze your customers, ensure to have PaySketch connected to PayPal.

The Customers Dashboard looks as follows:-

Customers Dashboard

Customer Dashboard Sections

The Customers Dashboard highlights data in the following sections:-

Header

The header of the dashboard contains vital statistics such as account balance, the number of customers acquired in the day, customer acquisition in the month and the total number of customers acquired. These values change dynamically with new customer acquisitions and dashboard revisited.
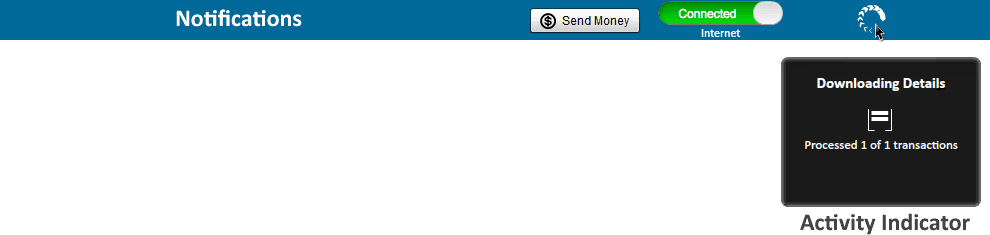
Customers Dashboard Header

Notifications

The notifications section in the dashboard remains the same, as in Transactions Dashboard, Sales Dashboard and Payments Dashboard. It shows notification messages, an internet activity indicator, a Send Money button and an application activity indicator. Details about the application activity can be known by hovering over the activity indicator, when it is visible.
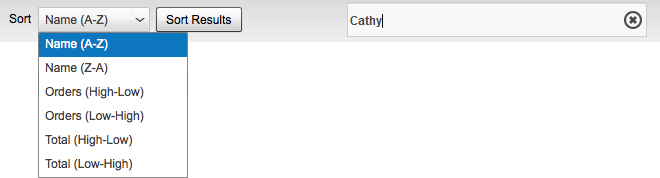
Customers Dashboard Notifications

Filters

The filters section in the Customers Dashboard is different than what one will find in the other dashboards in PaySketch. Filters let you quickly access customers in the right fashion and the realtime search box helps you get to just the right customer you wish to look up. The following filters/sort capabilities come embodied in the Customers Dashboard:-

  • Sort Customers – sort and reverse sort customers by name, total number of orders and by the total amount spent on orders
  • Real time search – Type in a part of the customer’s name or email address and the search results will start showing up in the Data section. You can also search customers by typing in their total order amount and the Customers Dashboard will list all the matching results.

Customers Dashboard Filters

Data

The data section of the Customers Dashboard is horizontally segmented into 2 components:-

Customers

In Customers you will be able to view all the customers who have purchased from you through PayPal. The customers grid lists the name, total number of orders and the total amount of processed orders in the grid columns. These columns are configurable and more columns can be added from the Settings Dashboard of the application. You can add columns such as email address and fees charged to you for all orders processed.

One can also export PayPal customer details by clicking on the download button shown below the Customers grid.

Details

This component shows details about customers – their name, email address and the amount they’ve spent till date on purchasing products or services from you. The application also shows an email icon, which when clicked will open the default email client on your computer so that you can directly write an email to your customer.

Customers Dashboard Send Email

The details section has the following variable components:-

  • Order Details – shows details for each order processed for a customer. This component shows up by default.
  • Transaction Details – shows details for a transaction, when a hotspot link for the transaction is clicked.

HotSpots – the detail component has 3 hotspot links:-

  1. Name – clicking on the name of any customer in the Details component will list all transaction details for each order in the customers grid. You can then view transaction details for each individual sale.
  2. Email address – click on the email address does the same action as that of the name. The only difference is that names can be common, while email addresses are unique. Hence, an email hotspot will list all transactions that occurred for the particular email address.
  3. Transaction Id – the transaction id hotspot link shows in the Order Details. When clicked, it lists details about the particular transaction. Actions such as these are useful, when you’d like to view cases such as refunds or reversals. If a customer has purchased a lot of products from you, and have asked for a refund for most of them, then looking into transaction details will help you know their details, email addresses and even physical address where the purchased products were shipped.

Footer

The footer in Customers Dashboard is linked to the data as shown in the customers grid. It shows the total number of customers, orders processed, revenue and PayPal transaction fees charged for the processed payments.

Customers Dashboard Footer

Use cases

The PaySketch Customers Dashboard for PayPal, lets you:-

  • Contact PayPal customers
  • Email PayPal customers
  • Export email address from PayPal in CSV
  • Export PayPal Customers in CSV
  • Get PayPal Customer details

Summary Dashboard

Summary Dashboard

The Summary Dashboard is imminently visible as you open PaySketch. It is what we refer to as the ‘landing page’ of the product. The primary focus of the Summary Dashboard is to give you a complete insight into your PayPal account really quickly. This helps you keep track of milestones and provides a great health indicator of your online sales through PayPal.

This is how the Summary Dashboard looks like

PaySketch Summary Dashboard

The Summary Dashboard is segmented sections, each of represents a business vertical:-

  1. Sales
  2. Fee/Debits
  3. Payments
  4. Customers
  5. Products
  6. Geographic Insights

Sales

The Sales section is focused on PayPal Sales. To help you make quick decisions it includes a lot of actionable performance indicators such as :-

  1. Total Sales – Shows the total amount of sales that has been generated through your PayPal account from the time since when the PayPal account has been configured to connect to PaySketch till the last synchronization. By default, the amount shows up sales that has taken place in your account’s primary currency.
  2. Cleared Sales – Shows the total amount of sale transactions that are in completed or cleared state. This amount excludes all figures that account for pending, failed, canceled or reversed transactions.
  3. Subscriptions – This figure shows the net contribution of subscription based products/services to your business.
  4. Net Sales – Show the amount that remains after all PayPal transaction charges and service fees. This helps you figure out the total amount of actual revenue that you have made via online sales through PayPal, after paying all transaction fees.
  5. Pending – Many a times, you would receive payments via electronic checks or have payments are put on hold. This KPI accounts for all such sales which are still pending.

All statistics exclude Failed and Canceled payments. All the Sales indicators help you retrospect and forecast your online sales. They also provide you with valuable data such as the net earnings and the total fee.

Fees/Debit

The Fees/Debit section of the Dashboard is come right next and is focused on all the fees and charges around your PayPal Sales. This section includes:-

  1. Fees – Shows the total amount of fees that has been charged by PayPal for processing your online sales payments from across the world. This figure includes all transaction fixed and variable fees charged for processing each sales transaction.
  2. Refunds – Shows the amount and the number of refunds that have been processed through your PayPal account corresponding to the online sales through PayPal.
  3. Reversed – This KPI shows total number and amount of sales that have been reversed from your PayPal account.
  4. Chargebacks – Shows the amount and the number of chargebacks that were charged to your PayPal account for online sales.
  5. Failed – Stats around Failed or Canceled payments find place in this indicator.

Chargebacks and Refunds are good indicators of how well your products are being received (and perceived) by customers. A high number of chargebacks and refunds are red signals and demand immediate attention.

Payments

The Payments section of the Summary Dashboard shows all statistics around payments that have been made from your PayPal account.

  1. Payments – Shows the total amount of payments that have gone out from your PayPal account.
  2. Recent – Shows the last payment amount.
  3. Subscriptions – Shows the total amount of payments made for subscriptions/pre-approved payments.
  4. Refunded - Shows the total amount that has been refunded back to your account for payments that you had made.
  5. Withdraws - This indicator shows the total number and amount of bank withdraws that have been made from your PayPal account.

Customers

This section of the Summary Dashboard relays important information about Customers. It is crucial to understand how customers look at your products, how well they find them, when are the most likely to order and at what frequencies are you connecting with your customers. There are 5 important pieces of useful customer highlights that one can count upon while taking a bird’s eye view of all customers across the board.

  1. Customers – Customer count is shown for this part of the indicator. It is the total number of unique customers who have contributed towards the total sales.
  2. Repeat – Customer loyalty and retention are one of the key factors to market success. Customer Loyalty can be judged by looking at this parameter. The more returning customers you have in proportion to total customers, the more your products are loved.
  3. LTV (Life time value) - Show how much each customer, on an average has contributed towards to total sales of all products
  4. Pear Order Time – Show the peak time when most of the orders (by number) are processed. This indicator helps you realize the most important times when your online product sales – through website, email or invoicing should never have any order related issues. The peak time is when you can expect most of your customers purchasing and hence should be the most error free, without glitches website or business uptime.
  5. Order Frequency – The number of days, hours, minutes and seconds between each order is what this indicator shows. A large order frequency means that the average time interval between any 2 orders is high.

Hover over any of the indicators to gain more insight, like the one shown belowPeak order time

Products

The Products section immediately follows the Sales section. Products are what you sell online to make a successful business and valuable data around your products help you measure, gauge and act upon their market performance. While designing PaySketch, we looked at the best key performance indicators for product which can deliver simple yet impacting analytics so that you can take your product sales to the next level. The Products section comprises of 2 fragments:-

Highlights

Highlights gain quick attention and lets you easily figure out just the right data you need to know about your products market performance:-

  1. Products - Shows the total number of unique products that have ever been sold online through your PayPal account since when you had configured PaySketch to connect and bring in PayPal data from your account.
  2. Products Sold – Shows the total number of product sales.
  3. Highest Selling Product – A bright indicator which quickly tells you the best selling of all the products in your portfolio. Remember, this is best selling when we account for the number of times it has been sold and not be its revenue contribution. Hovering over the best selling product, you will know the exact number of times it has been sold and the total revenue that it has contributed to your online sales.Highest selling product
  4. Least Selling Product – This indicator comes in handy to know which one of the products is the least selling of all. It may not be the least contributing, but in numbers all other products have sold equally or more than the one that gets listed. It should be fine if the product is a newly introduced one, otherwise, poor marketing, visibility or falling market demand could be possible reasons.
  5. Most Refunded Product – The product listed under this domain is the one that has been refunded the most. It may be because customers often find issues with this product or it could very well be one of the highest selling products and proportionally has a refund rate. If its not, then this indicator warns for the same and customer feedback could help improve the same.

Performance by Revenue

Product performance can also be measured by the revenue contribution of the products. On the Summary Dashboard, the top 5 contributors and the 5 least contributing products to the overall sales revenue are listed with their share of the same. There are 2 sections for both topline and bottomline products:-

  1. Grid – shows the top 5 / least 5 performers, their revenue contribution and the quantities sold
  2. Chart – the charts of each type organizes the slice of each contributor with respect to its segment i.e. each chart slice of top 5 performers depicts their individual performance when results are isolated to the 5 participant products. Hovering over the slices will show further information like the percentage contribution of the product towards the Total Sales.Product performance

Geographic Insights

The Geographic Insights section focuses on mapping sales to different parts of the world and showing performance indicators such as:-

  1. Countries – Total number of countries to which you have sold products/services to.
  2. Max Customers - This indicator points out the country from which you have the maximum number of customers.
  3. Min Customers - Lists the country from which there have been the least count of customers.
  4. Max Sales – Shows the country from which there have been the maximum amount of sales (in the selected currency).
  5. Min Sales - Lists the country from which your business has received the least sales for the selected currency and timeframe.