Payments Dashboard
Payments Dashboard
If you have a PayPal account, then there are high chances that you might have used it for making online payments. The Payments Dashboard in PaySketch shows all the payments that have been made through your PayPal account. It is quite productive to keep track of payments through PayPal as many a times, canceled subscriptions and unauthorized PayPal transactions can be taken care of by having a look at the payments. The Payments Dashboard also comes handy to calculate all the expenses that have been done through a period of time while generating profit and loss report for your business through PayPal. Before you analyze your actual payments (and not the demo data), be sure to have setup PaySketch with PayPal.
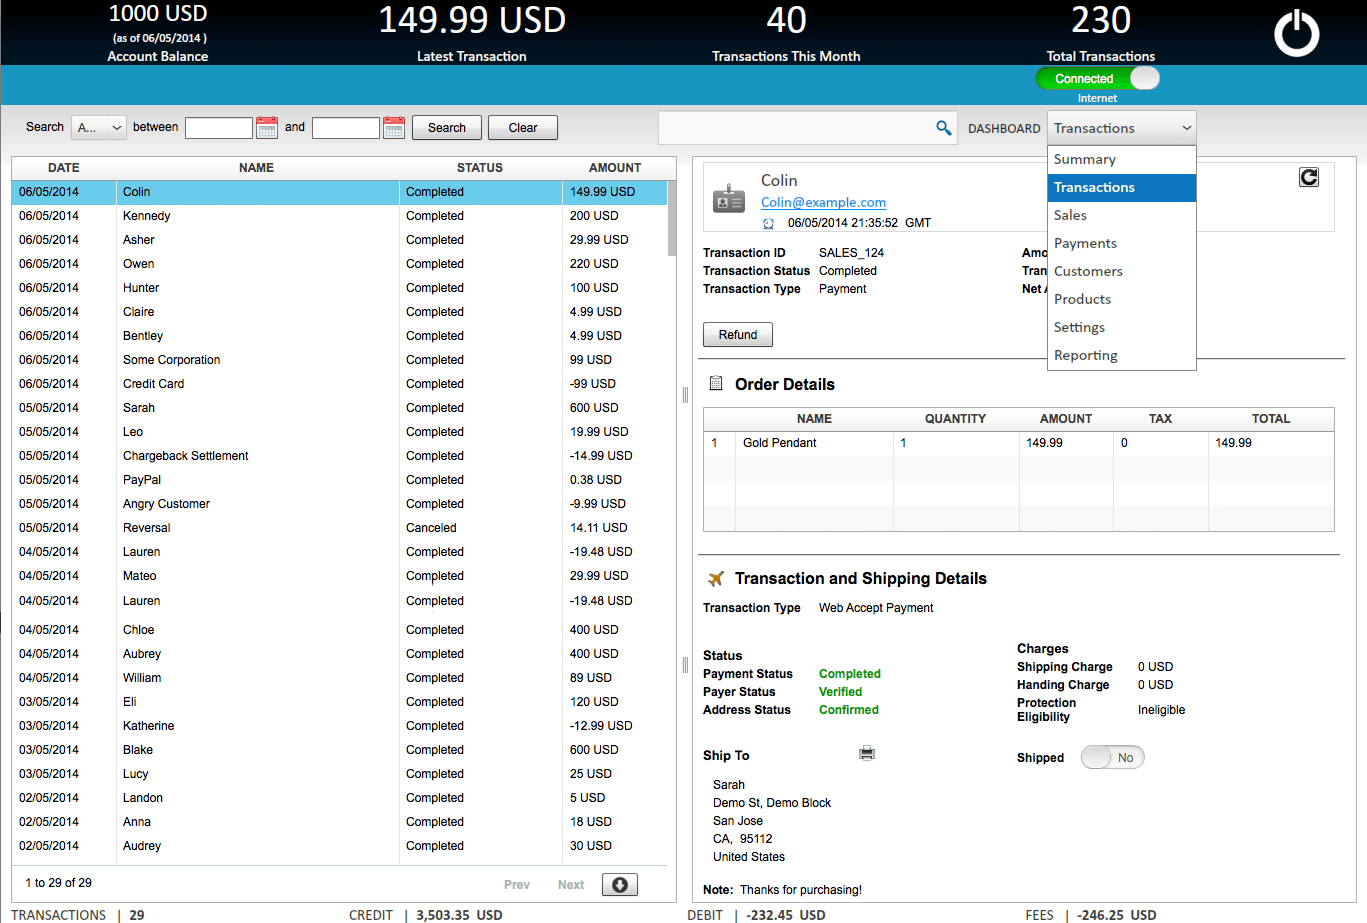
Navigate to the Payments Dashboard by select Payments from the Dashboard dropdown menu.
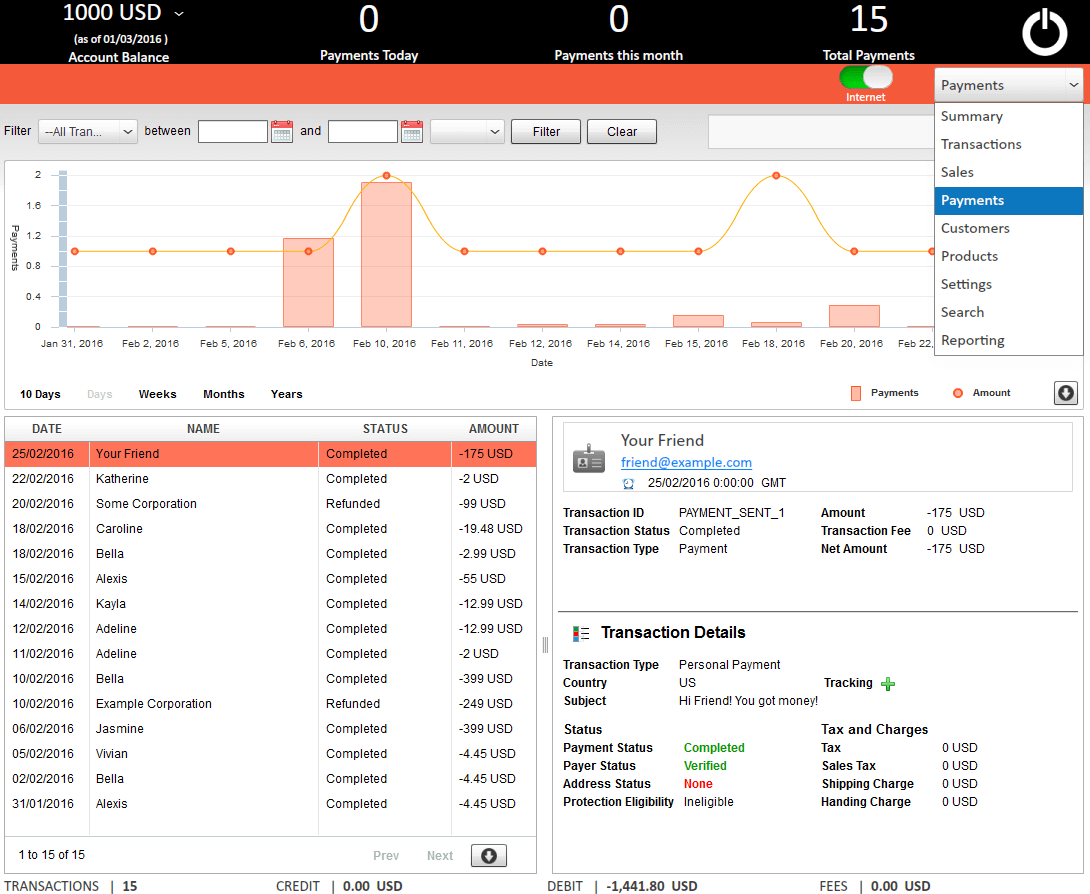
Payments Dashboard Sections
The Payments Dashboard has the following sections shown in the user interface:-
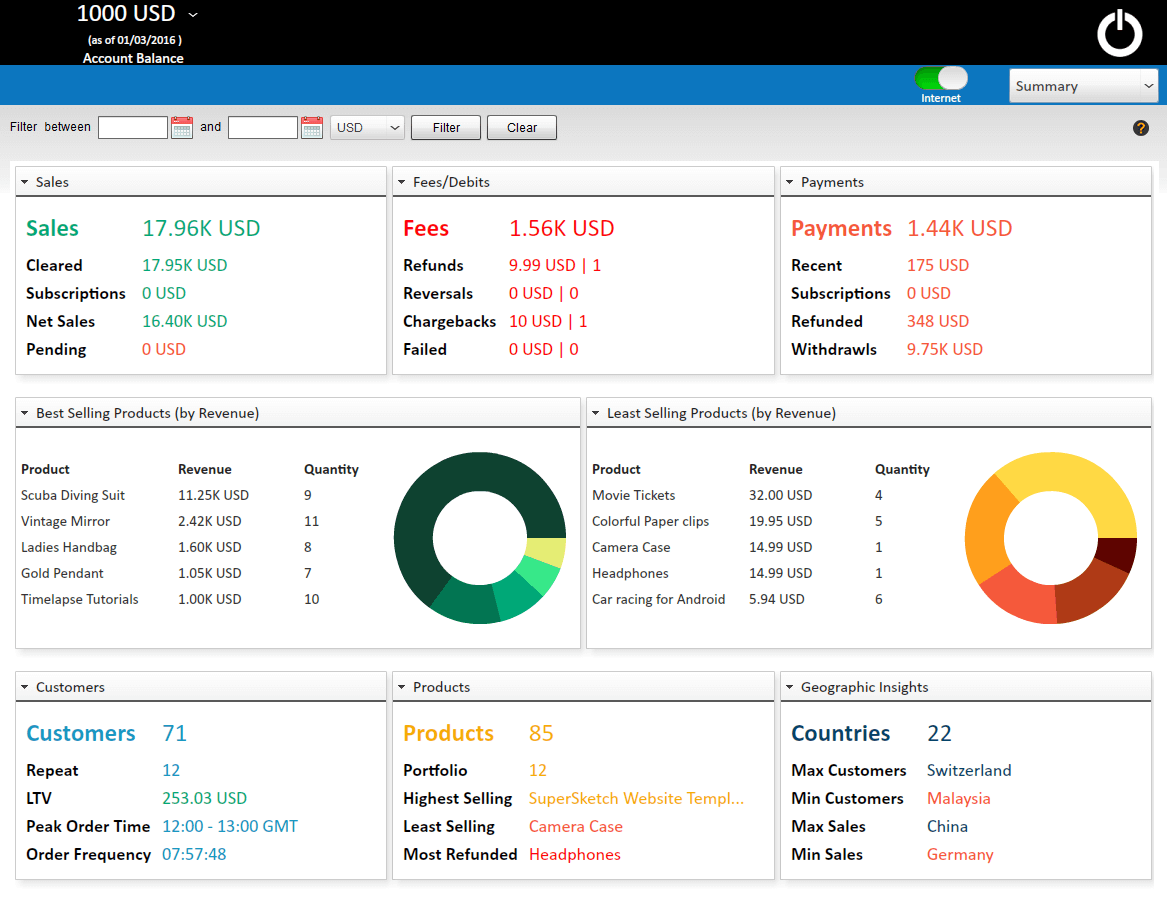
Header
The header section of the Payments Dashboard shows the account balance, the payments that have been made on the day, payments made in the month and total payments. The header gives good enough information to keep you on alert when you see an increase in the payments being made.

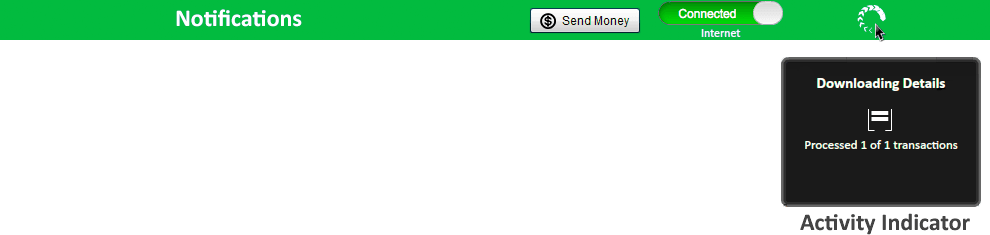
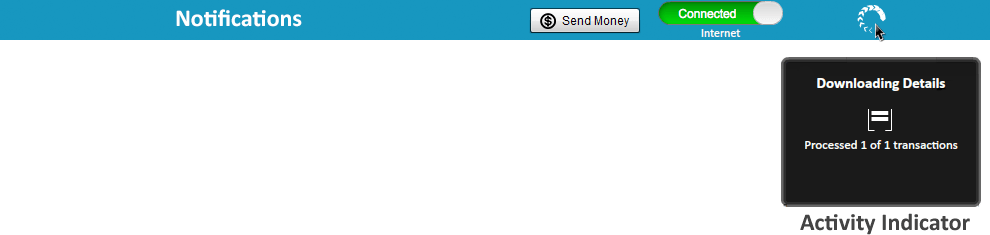
Notifications
The Notifications section of the Payments Dashboard, like other dashboards, will show notification messages for warnings, errors and information. Besides it also shows the Send Money button, an internet connectivity indicator and an activity indicator.
![]()
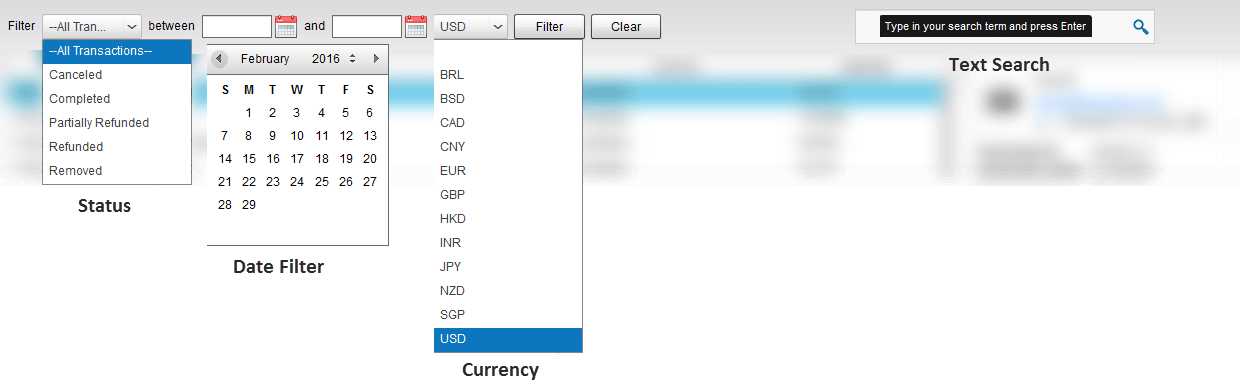
Filters
Filters in the Payments Dashboard lets you filter all payments by a Transaction Status, also allowing you to limit the search results by a date range. Real time search box lets you search through names, email address, amount and currency of payments, as you type.
Data
The Data section is divided into 4 components:-
- Trend Chart
- Highlights
- Payments
- Details
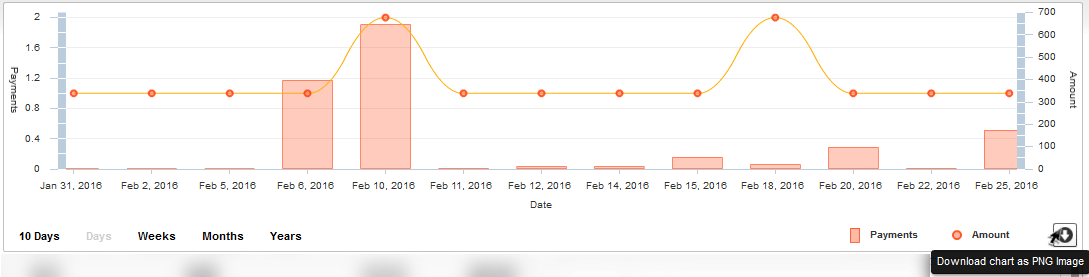
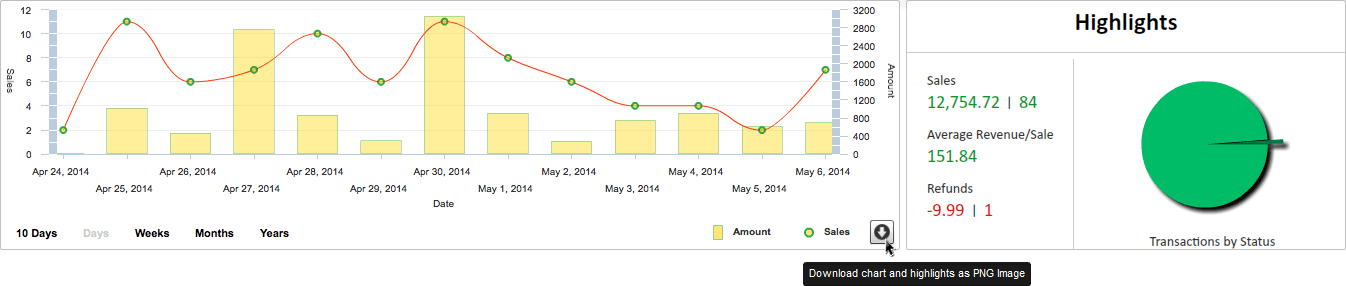
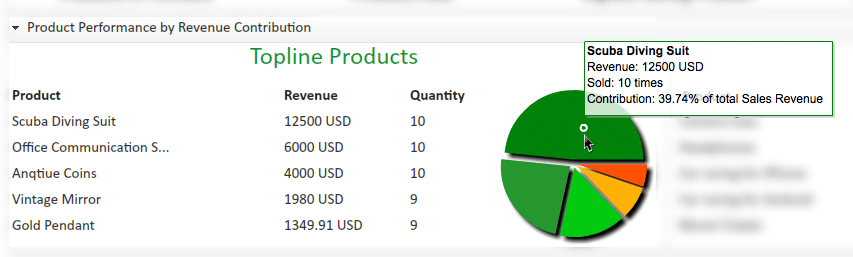
Trend Chart
The trend chart shows payment trends over set intervals of time. It defaults to months, but can the chart can be set to show data for days, weeks and years too. Trend analysis of PayPal payments help you get deep insight into areas where all the payments have been drawn from your account. A sudden spike or a growing payments curve could act as an alert for unauthorized PayPal payments or charges for subscription services which were canceled but your account still got charged for the same. Trend analysis also helps you keep a tap on the expenses and helps you better plan for the future of your online business.
Highlights
Highlight are dynamic indicators which reflect the total and average payment amount in numerals. It also shows a chart distributing the payments you’ve made by their status (for example – payments for a few services you might have purchased via eCheck might still be in pending status). This data section gives you quick numbers for analysis and keep your away from doing all the calculations.
Both, the trend chart and highlights show a change of state and data as you search for payments, thus allowing better pictorial view from across the board to the filtered results. The chart and highlights can also be quickly downloaded as a PNG image by clicking the download chart button.
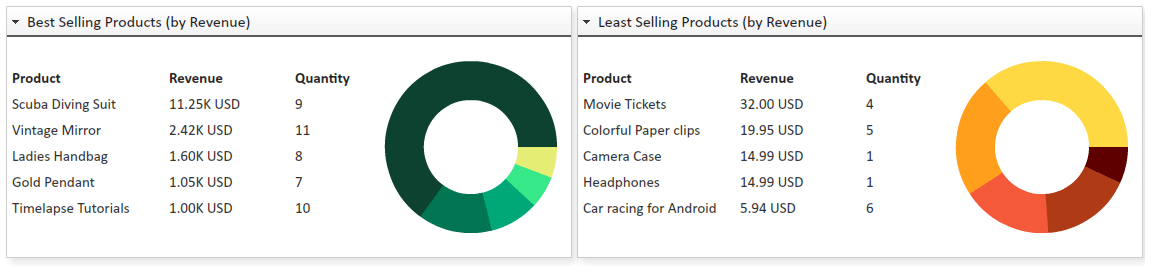
Payments
All the payments will show up in the payments grid, reverse sorted by date. Clicking on the payments will show their details on the right. Grid data is paginated by a set number of rows which can be configured from the Settings Dashboard.
Details
The details section will show details for each payment that has been made from your PayPal account. To view details of any particular payment, simply click on the payment from the payments grid and details for the same with show up in this section. Payments, like Sales Dashboard, also has 3 fixed and a variable component:-
Fixed components are:-
- Details
- Seller’s name
- Seller’s email address
- Transaction time
- Transaction ID
- Transaction Status
- Transaction Type
- Amount
- Transaction Fee
- Net Amount
- Order Details – shows the details of the product purchased – name, quantity, amount, tax and total.
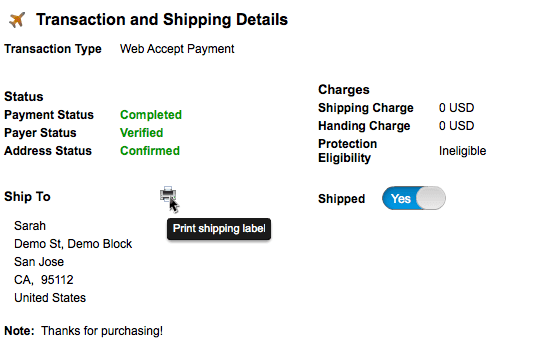
- Transaction and Shipping Details – shows further details about the transaction such as multiple statuses and charges. Shipping details include the status at which the seller is suppose to ship the product (for which the payment was made).
The Variable component is:-
- Related Transactions – this component is visible when the transaction has one or more related transactions. This could be due to refunds, reversals, chargebacks or eCheck failures.
Footer
The footer section in Payments Dashboard shows the total number of payment transactions, credits, debits and the total fee (if any) has been charged to you for processing the payment.
Use cases
Using the PaySketch Payments Dashboard for PayPal, you can:-
- Export PayPal payments.
- Generate PayPal payments report
- Track PayPal payments
- Monitor payments through PayPal, and file a dispute if the offered product/ service has not been received
- View payments going through subscriptions
- Safeguard PayPal balance by monitoring any unauthorized payments


