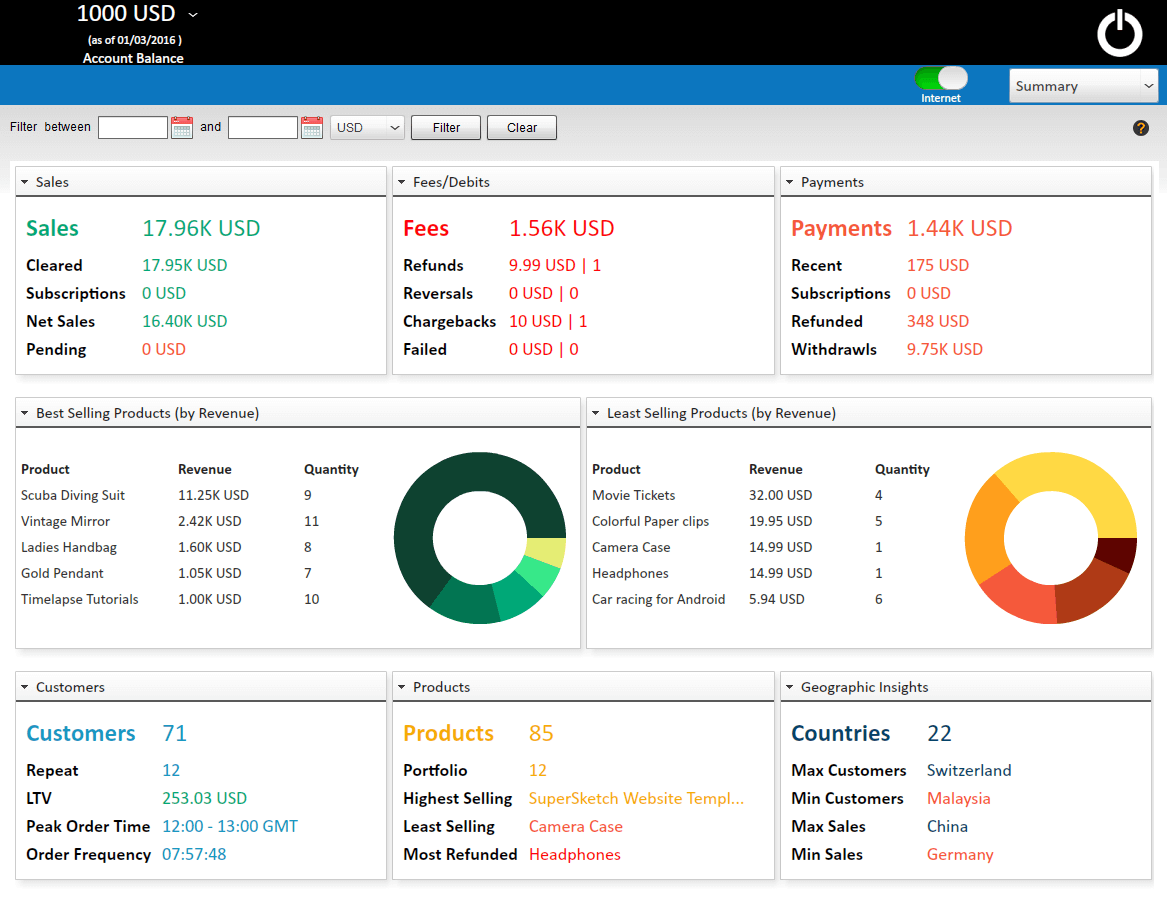
Sales Dashboard
Sales Dashboard
The Sales Dashboard in PaySketch lets you easily manage and track PayPal sales. All sales made through your PayPal account will be automatically pulled into PaySketch after you have connected PaySketch with your PayPal account using the PayPal API Signature. All sale transactions will be listed in a grid, along with details showing up on the right. A trend chart and highlights about the sales provide precise indicators to the past and current health of sales, which will help you foresee and forecast your future sales.
To navigate to the Sales Dashboard, select Sales from the Dashboard dropdown menu. This is how it looks:-

Sales Dashboard Sections
The Sales Dashboard has the following sections:-
Header
The Header section in the sales dashboard gives you quick insight into sales through PayPal. It shows the current account balance, the most recent sale amount, total sales in the month and total sales overall since when the PaySketch has been configured to pull data from PayPal.

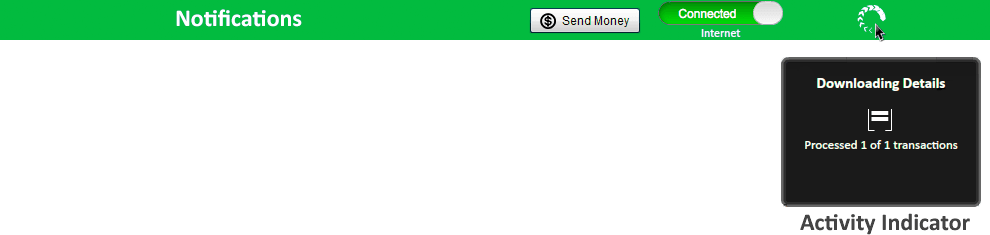
Notifications
The notifications area in the Sales dashboard contains a message/ warning/ error area, a Send Money button, an internet connectivity indicator and background activity cum process indicator.
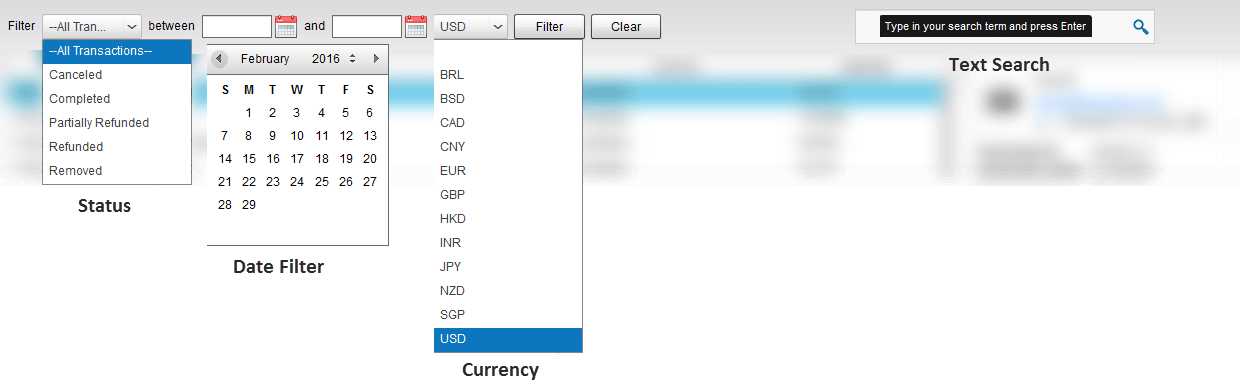
Filters
The filters section is similar to the one in the Transactions Dashboard. Users can filter and search all sales through PayPal using the transaction status, date range and real-time search box filters. Filtered results automatically appear in the data section.
Data
The Data section of Sales Dashboard can be divided into 4 primary components:-
- Trend Chart
- Highlights
- Sales Transactions
- Transaction Details
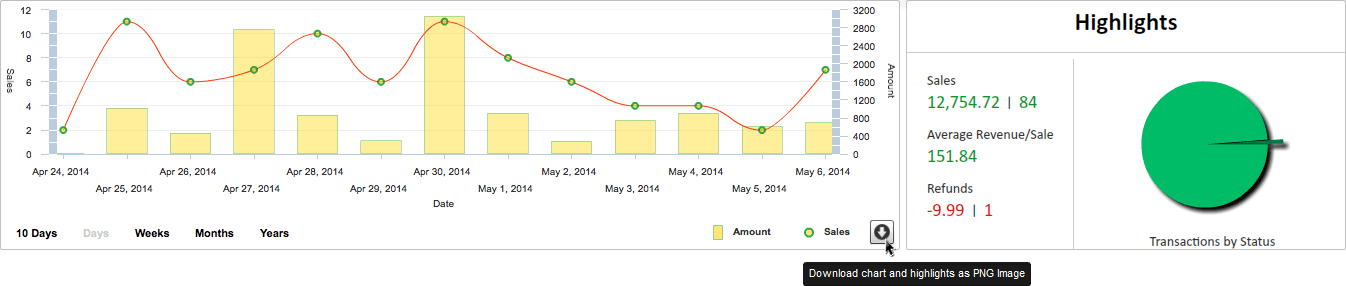
Trend Chart
The trend chart in the dashboard shows Sales trends over a period of time. By default, when the dashboard loads all the data, the sales trend is segmented by Months. Trends help analyze PayPal sales performance, peaks and lows, market penetration, and the overall value that the business bring in a period of time. The data in the trend chart is directly linked to all search criterias – so you can see live changing trends as you search for sales transactions on PaySketch.
Trends can be dynamically configured by simply clicking on the time slots by which the trends need to be groups. Sales trends can be groups by Days, Weeks, Months and Years.
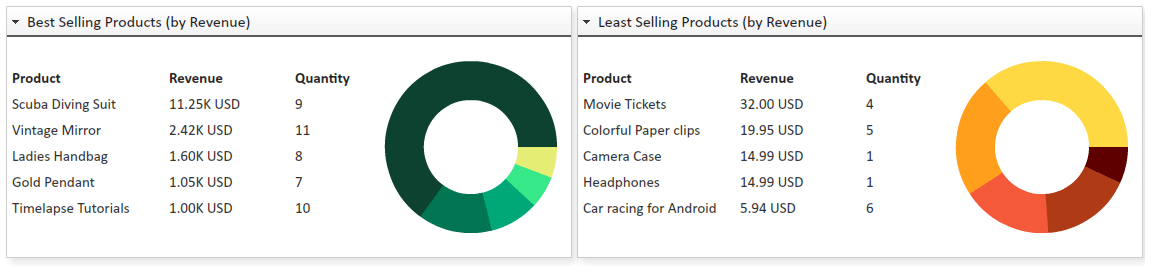
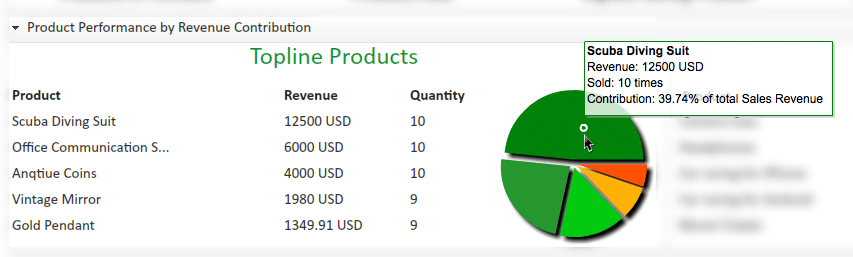
Highlights
Highlights is high-level numeric spotlight focused on bringing you the most important sales indicators. Highlights show sales, average revenue per sale, refunds and statues of all transactions by means of a pie chart. Highlights are dynamic and sensitive to search – so which you search for transactions between a particular date, you can see the highlights respond to search. For example, you can figure out the total sales, refunds and status distribution of your online sales between 2 dates. Or you could simply search for transactions for a set of particular customers by typing in their names and view the revenue contribution and refund requests from them.
One can also download the trend chart with the highlights by simply clicking on the download button shown right below the sales trend.
Sales Transactions
The Sales transactions show up in a grid, reverse sorted by the date of purchase. The grid also reflect changes to the data and is automatically refreshed as newer sales happen and the dashboard revisited. Filtering data through real time search or by inbuilt transaction status and date range filers also show their results in this section of the sales dashboard. The data presented is paginated and this configuration can be changed or disabled from the Settings Dashboard.
Details
Details for each sale will show up right next to the transactions grid, one sale at a time. The data in this section gets changed as one browses through different sales transactions as shown in the grid. Details have 3 fixed and a variable components which are shown depending on the type of transaction whose details have been requested for.
The fixed components are:-
- Details
- Buyer’s name
- Buyer’s email address
- Transaction time
- Transaction ID
- Transaction Status
- Transaction Type
- Amount
- Transaction Fee
- Net Amount
- Order Details – shows the details of the product purchased – name, quantity, amount, tax and total.
- Transaction Details – shows further details about the transaction such as multiple statuses and charges.
The variable component is:-
- Related Transactions – shows up in case the transaction in question has other transactions related to it. This happens in case of refunds, reversals, chargebacks etc.
Footer
The footer section of the sales dashboard reflects indicators for all sales transactions that show up in the sales grid. The footer contains information such as:-
- Total Sales – which are listed in the grid. This helps in case you have broad search parameter and would like to know the number of sales made.
- Sales – Amount of gross sales made.
- Net Credit – reflects the net sales.
- Fees – shows the total fees charged via PayPal for processing the sales orders.

Use cases
Using the Sales Dashboard in PaySketch, you can:-
- Export PayPal sales, all or a part of it.
- Generate profit report for sales through PayPal
- Generate Monthly PayPal sales report
- Track total sales through PayPal
- Download PayPal sales report in CSV instantly, without waiting
- Do a lot of slicing and dicing with the data to analyze PayPal sales